Evaluating Scalar Meshes with the Measurement Inspector
You can evaluate the different statistical properties available for scalar meshes, as well as select a color ramp, make range selections, and adjust opacity settings in the Measurement Inspector.
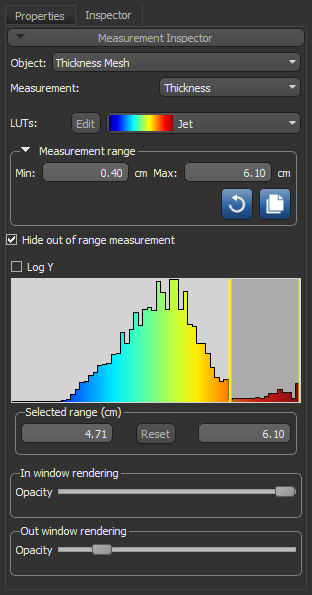
To open the Measurement Inspector panel shown below, right-click a mesh that contains scalar information and then choose Measurement Inspector in the pop-up menu.
Measurement Inspector
| Description | |
|---|---|
| Object | Lets you select the mesh to examine in the scene views. |
| Measurement |
Lets you select the measurement to plot in the histogram and view onscreen.
Note You can rename a measurement by double-clicking inside the Measurement box. |
| LUTs | Lets you select a LUT function to apply to the histogram and views of the selected mesh in the current scene (see Using the LUT Editor for information about editing a LUT). |
| Measurement range |
Lets you select the range of data that will be plotted, as follows:
|
| Hide out of range measurement | If selected, values that are outside the selected measurement range will not be shown in the views of the selected mesh in the current scene. |
| Log Y | If selected, the values on the Y axis will be plotted in log scale on the histogram. |
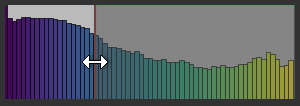
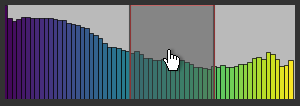
| Histogram |
Shows how values are distributed in the selected mesh and lets you adjust the threshold values for the In window and Out window rendering options.
|
| Selected range |
Indicates the minimum and maximum threshold values, which define the In window range.
|
| In window rendering | Determines the opacity of the In window values in the views of the selected mesh in the current scene. |
| Out window rendering | Determines the opacity of the Out window values the views of the selected mesh in the current scene. |